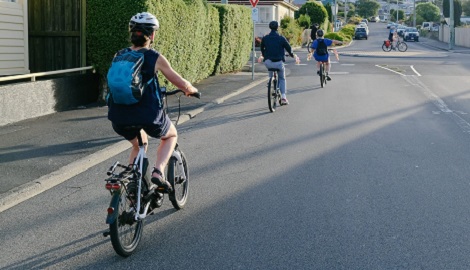
How we make a difference
With the help of nearly 50,000 members nationwide, Bicycle Network is making it easier for everybody to ride a bike, every day.
ADVOCACY
MEMbership
BEHAVIOUR CHANGE
Services
EVENTS
Latest bike riding news
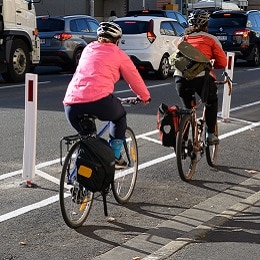
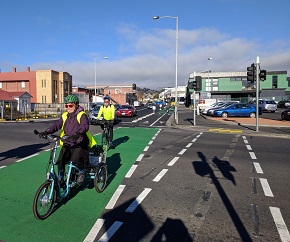
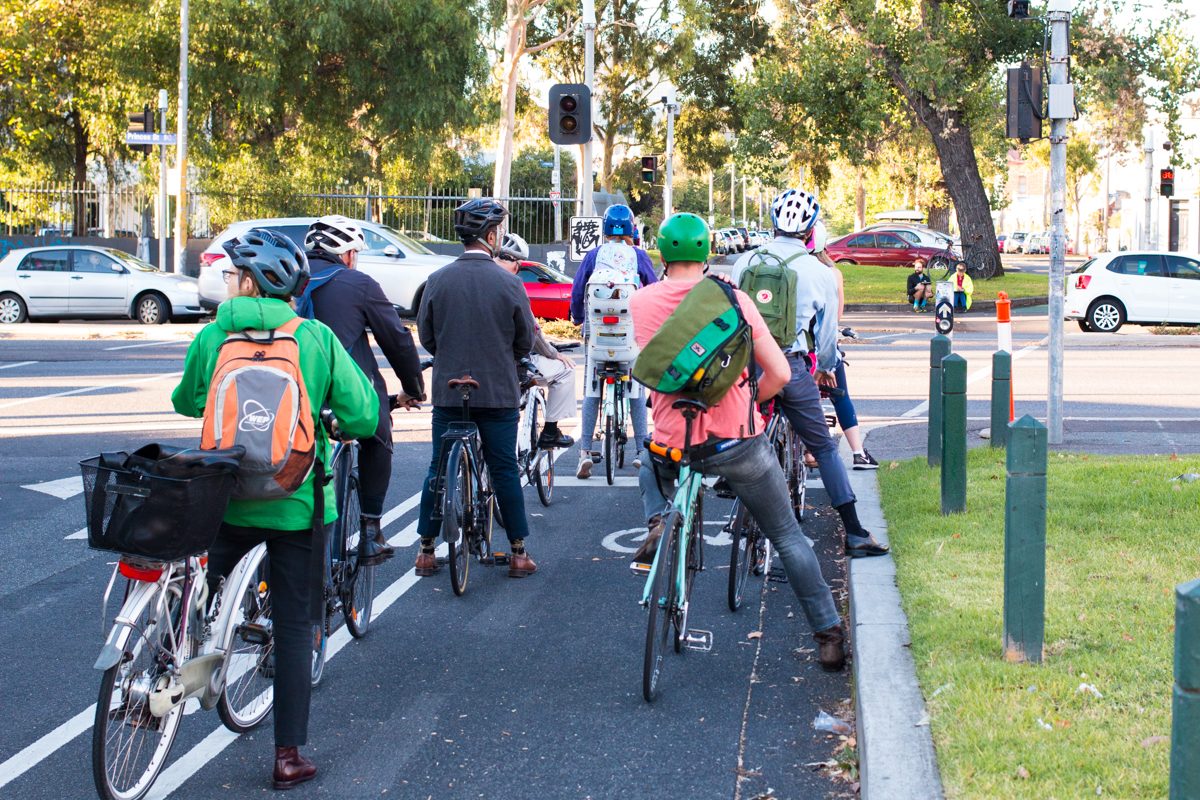
Wait for it … separated cycleways have arrived
After a wait of several years, Hobart’s first city centre separated bike lane has been installed on Campbell Street.
Latrobe Council looks at cycling connections
Latrobe Council has released a draft plan to improve its town centre which includes cycling connections between the Coastal Pathway and Wild Mersey mountain bike...
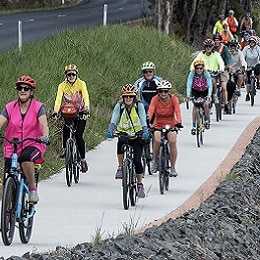
Popular rail trail reaches inland NSW
Another section of the Northern Rivers Rail Trail has opened for business, offering users a new stretch of magnificent off-road riding through northern New South...
New housing plans offer active transport solutions
The Victorian Government has announced an ambitious program to stimulate housing development at ten suburban activity centres across Melbourne.
… want to hear more?
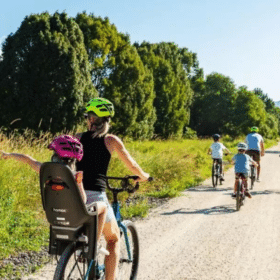
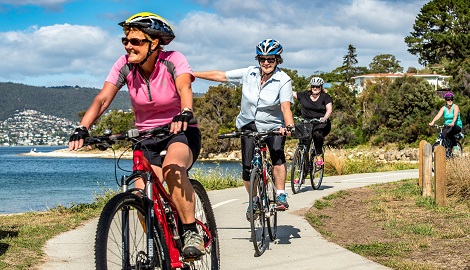
Time to get on your bike
From social rides to self-guided tours, we are happy to share the wonderful cycling experiences Tasmania has to offer.
Back on your bike helps people to start riding again with a skills refresher, basic bike maintenance and group ride.
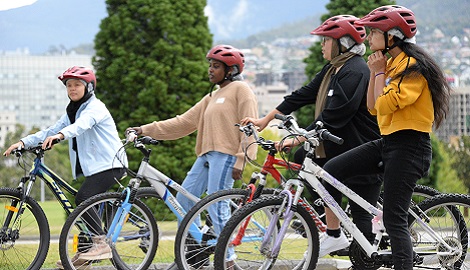
Join one of our Bike Week activities
Get active, have fun and connect with your local bike riding community during Tasmanian Bike Week.
Check out what else is happening in your state
Join the team
Volunteer with us
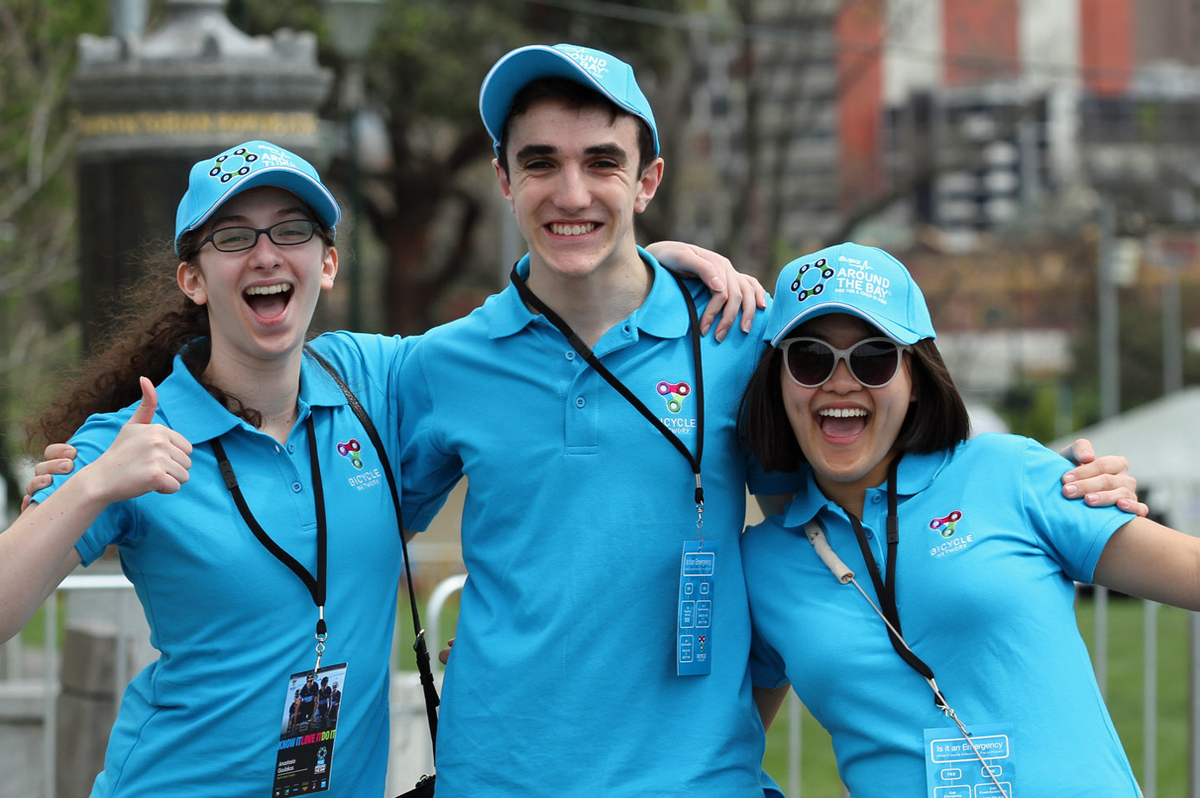
Volunteer with us to help make bike riding easier.
Whether you join us in the office, or out on one of our iconic events, you’ll learn new skills, build great relationships and play a role in building a nation of bike riders.
Learn moreBecome our friend
Find out more about Bicycle Network and support us in making it easier for people to ride bikes.